Most rocket launch tracker sites give you a date and leave you to trust it. We wanted one that says how sure it is. Space Right Now follows launches, the International Space Station and Voyager 1 on one journey outward from Earth, and every launch time states how precisely it is known. It is a non-commercial project we built and run, with no ads, no accounts and nothing to buy. It soft-launched in October 2026 and we have not promoted it, so this post is about the build rather than the audience.
What a rocket launch tracker should tell you
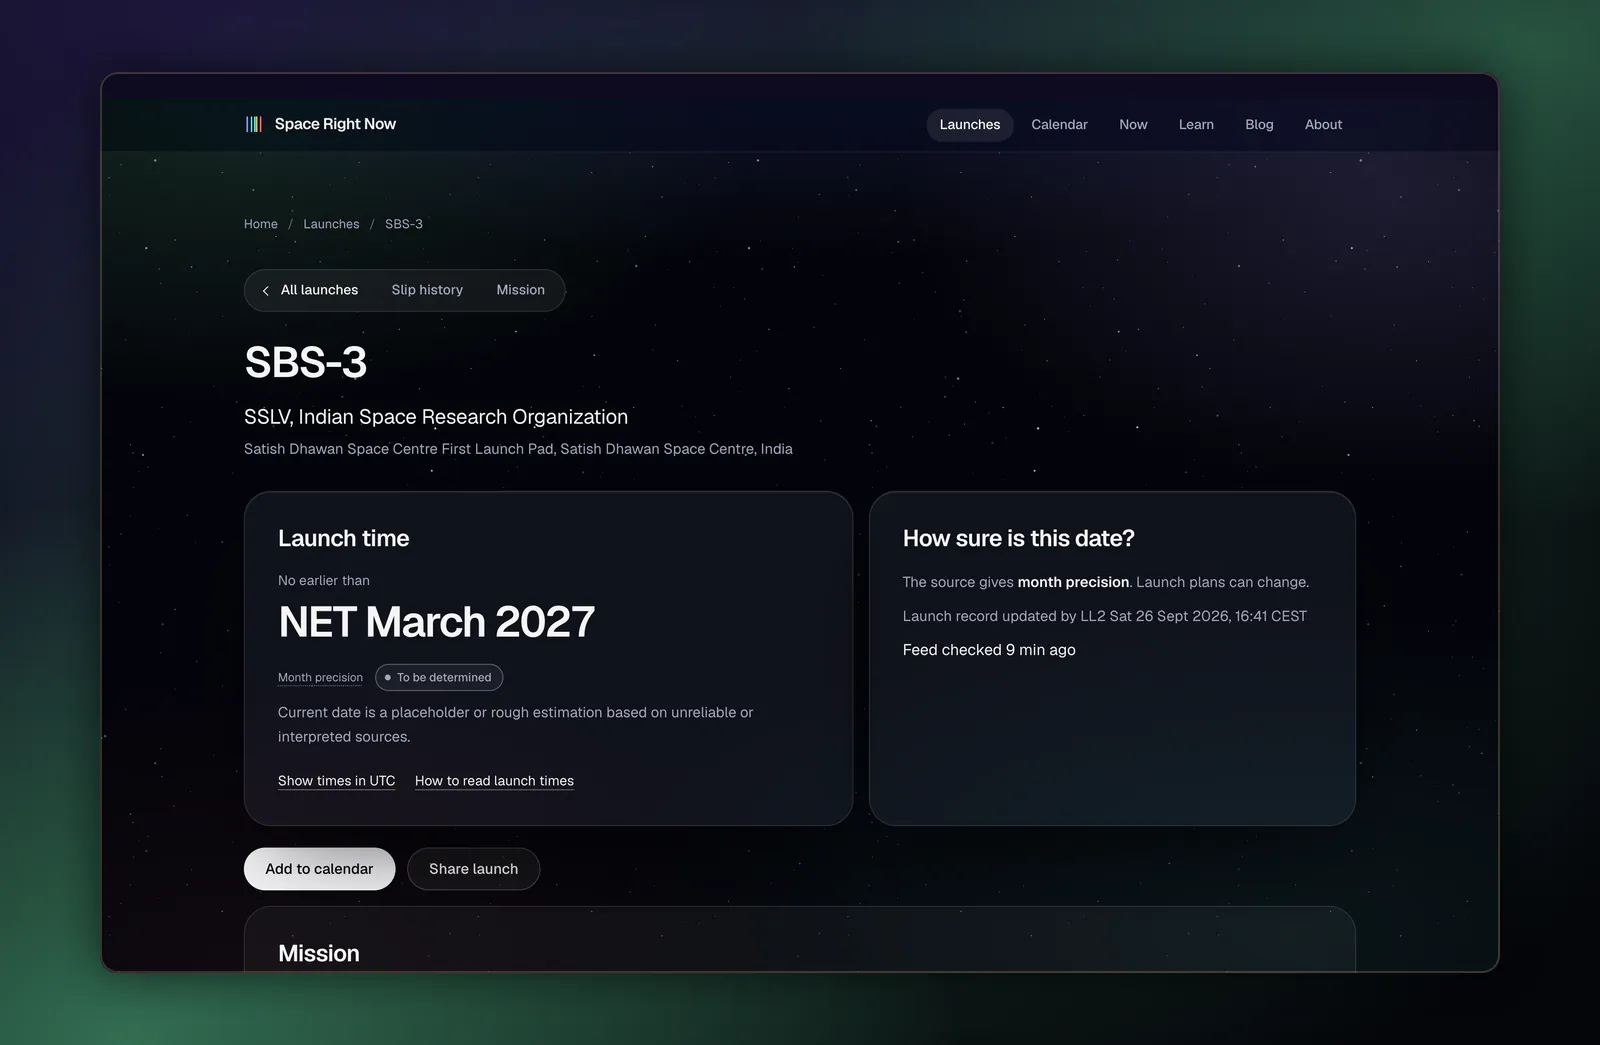
Launch times disagree between sites, and there are good reasons for that. One source shows the start of a launch window, another the target time. A date marked NET means no earlier than, which is a floor rather than a plan. A far-off launch may only be known to the month.
The difficulty is that most pages show all of these the same way. A date is a date. A reader cannot tell a firm time from a best guess.
That gave us one clear idea: make the uncertainty visible. A good rocket launch tracker should tell you when a launch is planned, how precisely that time is known, how sure the plan is, and how often it has moved.
The decision to build
We love space, and we wanted the clearest place to follow what is happening in it. It also made a useful test of what we can build when nobody is asking us to.
The idea for the design came from a simple fact: distance in space is really time. Light reaches the Moon in just over a second and takes most of a day to reach Voyager 1. So the site is organised as a journey outward, measured in the time light takes to get there.
Showing uncertainty on the page
Each launch page carries two plain cards. One is the launch time. The other asks how sure this date is. A launch due within days might be known to the minute. One due next spring might read NET March 2027, known only to the month, with a note saying plans can change.
The same labels run through the schedule, so you can scan a list and see which times to trust. Times show in your local zone, with a switch to UTC, and each page says when the feed was last checked.
Architecture and stack
The site uses Next.js on Vercel, with Supabase Postgres in Frankfurt and three.js for the 3D journey.
Launch Library 2, CelesTrak and NASA/JPL data arrive on a schedule. The browser never calls them directly. Fixed rules decide what a time or a status means, and AI does not decide either. Each source shows its last successful update, and the page says so when a feed goes stale.
From that feed the site generates more than 1,000 pages, mostly one per launch, including the historical archive. Each launch keeps its own record of date changes, so a slipped launch shows its history rather than quietly changing.
The AI layer and its guardrails
AI agents wrote the code and the explanatory pages under our direction. Each of those pages says so and lists its sources. The site uses no AI images or video.
The line we drew is simple. AI can help explain how a launch works. It does not get to decide when one is happening.
Imagery follows the same discipline. Every film, texture and model is listed on a credits page, with its licence and the edits we made.
What shipped
The homepage is a six-chapter 3D journey on desktop, from the launch pad to Voyager 1, with live figures in the panel beside it. Phones and tablets get a film version, and a reduce motion control stays one click away.
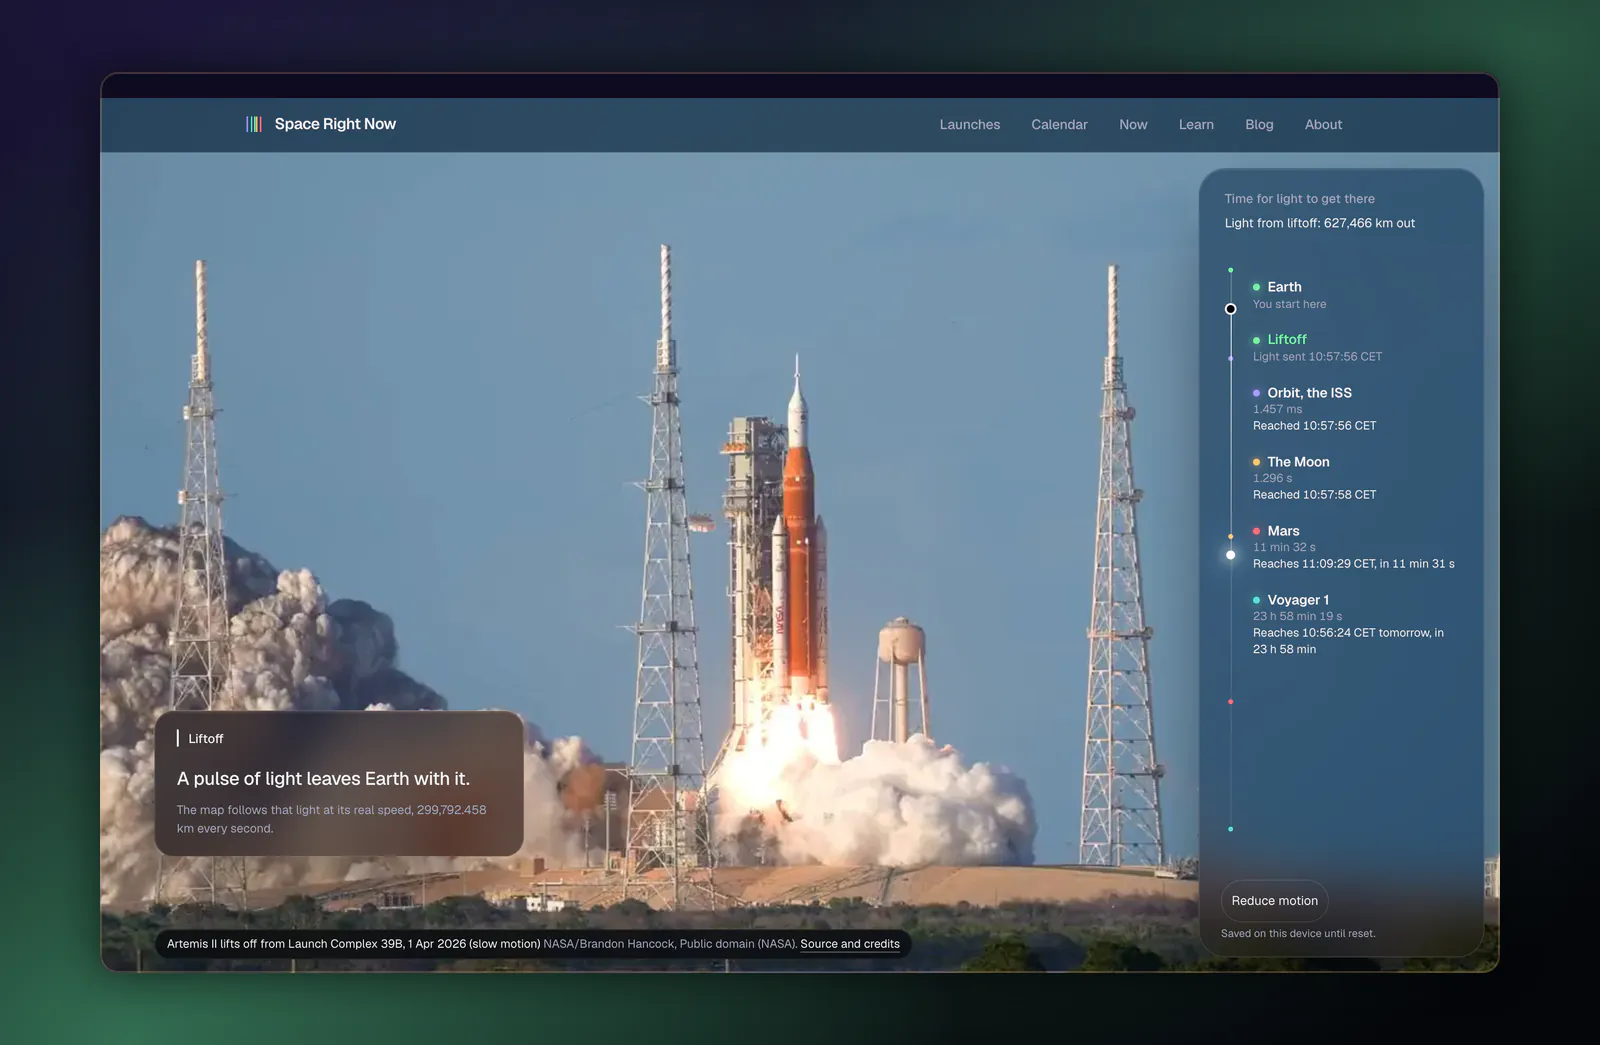
The panel beside the journey is the idea in its simplest form. It lists how long light takes to reach each stop: 1.3 seconds to the Moon, roughly 12 minutes to Mars in November 2026, and very nearly a full day to Voyager 1. Those figures are computed rather than typed in, so they move as the planets and the spacecraft do. Scrolling through the journey gives you a feel for scale that a table of distances cannot.
Alongside it are a launch schedule, a page for each launch, a 24-hour What changed briefing built from stored records, a calendar feed, and a countdown to Voyager 1 reaching one light-day from Earth.
The What changed briefing deserves a note. It compares stored records and lists what moved in the last 24 hours, with the time each change was observed. Nothing is written by AI, so it cannot hype a delay or invent a reason for one.
Scale brought its own search work. Four sitemaps cover the site, launch pages carry structured data, and every page can be reached through the site's own links. A thousand thin pages would be worthless, so each one has to earn its place with real launch detail.
The site has no visitor accounts or cookies, and its analytics are cookieless. In a lab test on 6 November 2026 the homepage scored 100 for mobile performance and 99 for desktop on Lighthouse. Those are lab results, not field data.
What we learned
Your edge cases are in the wild. A read-only audit found that browsers reporting an unknown time zone crashed the homepage. For a site about times, that was a good reminder. We added a safe fallback to UTC and released it within days.
Beautiful heroes shift. The same audit found the desktop hero moving during load, enough to fail a layout stability check. A 3D hero has many ways to resize itself, so we stabilised its first paint and measured again.
A fallback is part of the design. A 3D journey will not suit every device, so phones and tablets get a film version. It is a real experience, not an apology.
Honesty is a feature. Saying how sure a date is turned out to be the most distinctive thing on the site, and it cost almost nothing to build compared with the 3D.
Licences are part of the design. Real imagery means tracking where it came from. Some NASA and JPL material has its own terms, and none of it may imply endorsement. Keeping the credits page right as we go is far easier than rebuilding it later.
Plan for being wrong. A site that publishes this much data will make mistakes, so it has a public corrections page. Knowing where a correction goes matters more than hoping you will not need one.
If you want something similar
Space Right Now shows how we turn messy, moving data into a product people can trust, at a scale of more than 1,000 pages, with search foundations underneath. If you have data that deserves a better home than a spreadsheet or a dated PDF, that is the same job.
See the full Space Right Now case study, read about our website services, or see how we kept published figures honest on Malta Calculator.
Book a discovery call and show us the data you wish people could actually use.